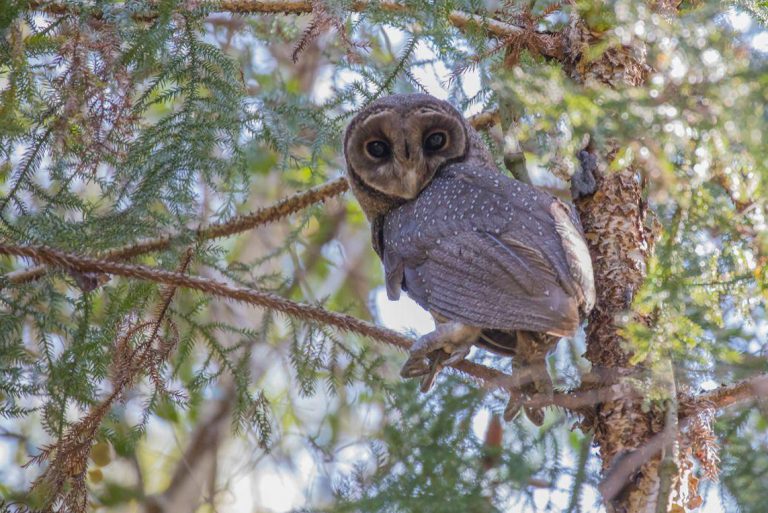
Greater Sooty Owl – Photo: Amanda Robertson
A demonstration of the functionality coming to EcoCommons, and the utility of HCAS
During the summer of 2019 – 2020 fires scorched over 18 million hectares of eastern Australian forests. These fires had unprecedented impacts on wildlife, but immediately after the fires, the magnitude of the impacts on each species was unclear. A number of organisations examined species distributions and overlaid fire distribution maps to get a better understanding of which species were hit hardest.
Here we show how the functionality within BCCVL can deliver these kinds of assessments rapidly. This functionality will be getting a major upgrade and will be moving to the EcoCommons platform in the next year. At EcoCommons it will be even easier to deliver results, obtain information on variable importance, and easily conduct sensitivity analysis on all parameter settings.
To showcase some of our great functionality we generated species distribution models for the Greater Sooty Owl and the Superb Lyrebird, species that can be found in the forests of southeastern Australia.
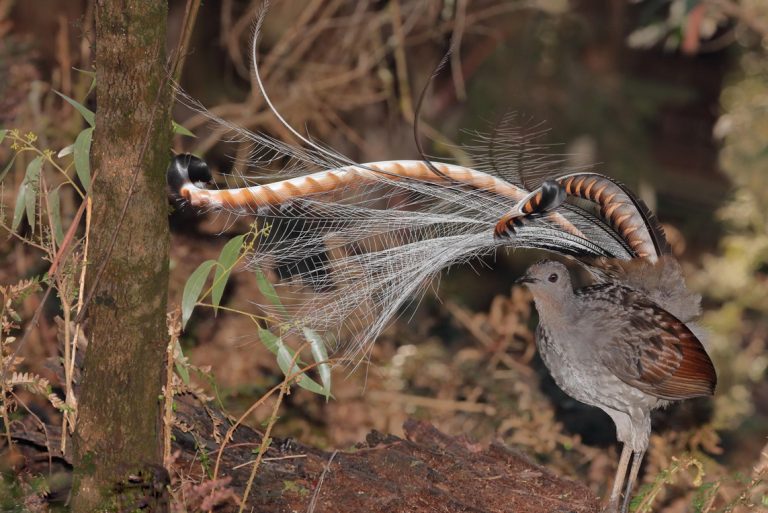
Photo: Ian Wilson
We modelled the species predicted suitable habitat at a coarse resolution of 1 km2 based on samples of their known distribution. We then digitally overlaid a map of the 2019-2020 south-eastern Australia megafires (Mackey et al. 2021) on these projections. We then calculated the percentage of predicted suitable habitat impacted by these widespread fires. The species distribution models were run within BCCVL and are described briefly below. The overlaying and processing of grid data were conducted in R, and the associated code is available here. In the coming year everyone will be able to do all this work within EcoCommons. While this wildfire burned with varying intensity, including unburnt refugia areas, here we just used the perimeter of the wildfire in our analysis.
We compared the results from four different modelling approaches: Maxent, Boosted Regression Trees (BRT), Generalised Linear Modelling (GLM) and Artificial Neural Networks (ANN). We then compared our rapidly generated results with those from other studies. We drew on the ATLAS of Living Australia’s (ALA) occurrence data and environmental predictors that are available within EcoCommons at the click of a button, including:
- Occurrence records for the Superb Lyrebird (86,258 ALA) and the Greater Sooty Owl (9,969 ALA, 3,548 BirdLife)
- Dynamic Land Cover – Original classification (5 classes)
- Australia, Enhanced Vegetation Index (2000-2008), 9 arcsec (~250 m) mean
- Australia, current climate (1976-2005), 30 arcsec (~1 km)
- B01 – Annual Mean Temperature
- B05 – Max Temperature of Warmest Month
- B12 – Annual Precipitation
- B13 – Precipitation of Wettest Month
- B14 – Precipitation of Driest Month
In one model we also compare results generated with collated and cleaned occurrence data from BirdLife Australia. In three models we explore the benefit of adding a Habitat Condition Assessment System (HCAS) derived environmental variable. HCAS uses remote sensing data to produce indices of habitat condition across the whole of Australia (Harwood et al. 2016, Williams et al. 2020, Figure 1).
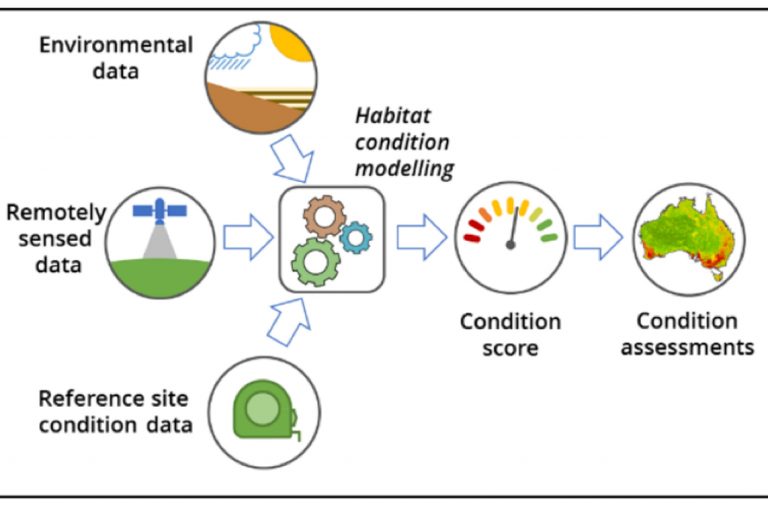
Figure 1. Overview of the HCAS input data and workflow that is used to produce a condition assessment layer (Lehmann 2021).
All models were run with default settings, except BRT models for Greater Sooty Owl where tree complexity was set to 3, and the learning rate was lowered.
What did we find?
The percentage of predicted suitable habitat that was impacted by fire was very similar in our modelling to the results generated by experts and researchers (Table 1). Our study, along with others, predicted that approximately 33-43% of the Superb Lyrebird and Greater Sooty Owls habitat was impacted by the recent bushfires (Table 1).
The total area of suitable habitat in our modelling varied substantially depending on the algorithms and data used (Figures 2 & 3). This was most pronounced in Greater Sooty Owl predictions with the total area of suitable habitat varying from 38,000 km2 to 140,000 km2. This indicates that as more habitat was predicted as suitable, the proportions of that habitat which was either burned or unburned remained constant. In the predicted distributions (Figures 2 & 3) there were areas where all models indicated the fire had impacted suitable habitat, but the variation in the total area of predicted habitat led to some large differences in where suitable habitat was predicted to have been touched by fire.
Table 1. Estimates of % of suitable habitat impacted by the 2019-2020 Australian bushfires.
| species | BirdLife | Ward et al. 2020 | NESP | Results from BCCVL |
| Superb Lyrebird |
34 – 43% (here) |
|||
| Greater Sooty Owl |
40% & 33% |
NA |
33 – 39% (here) |
The EcoCommons platform makes it easy to visualise model results, including habitat suitability maps (Figure 2 and 3). Each algorithm produces a habitat suitability map as well as useful evaluation statistics (AUC and TSS) so you can compare the results of each model. We can see that under the current environmental and climatic conditions each algorithm predicts slightly different habitat suitability and as a result, the impact of fire varies from 34%-43% for the Greater Sooty Owl (Figure 2) and 33%-39% for the Superb Lyrebird (Figure 3). For Greater Sooty Owl there was a jump in AUC & TSS with the inclusion of a broader set of cleaned occurrence BirdLife data. However, the biggest jump in predictive performance was shown when the fourth most important variable (Figure 4) derived from HCAS data was used as an environmental predictor in a maxent model for Greater Sooty Owl (AUC climbed to 0.98, and TSS to 0.85). HCAS did not improve the accuracy of Superb Lyrebird predictions nearly as much.
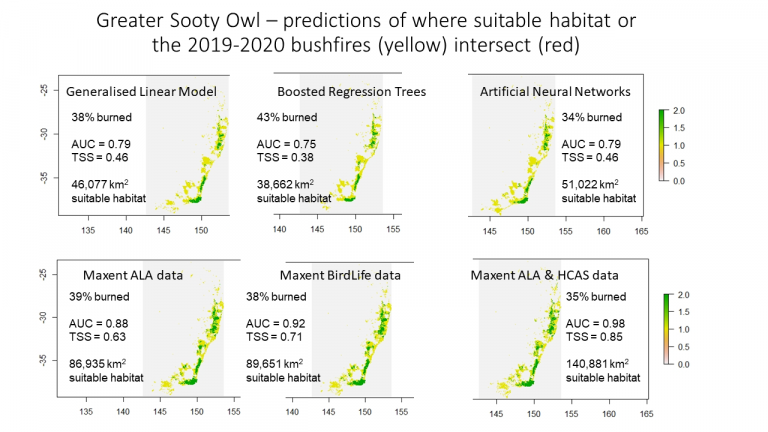
Figure 2. Predicted estimates of the percentage of Greater Sooty Owl habitat that was burned in the 2019 – 2020 Australian bushfires, with measures of predicted accuracy.
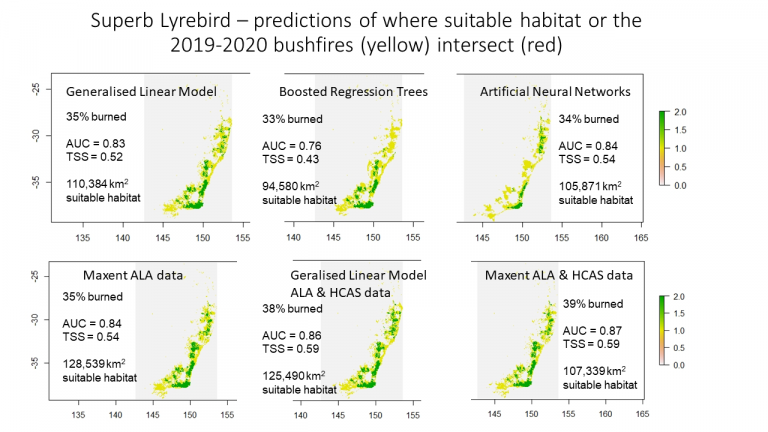
Figure 2. Predicted estimates of the percentage of Superb Lyrebird habitat that was burned in the 2019 – 2020 Australian bushfires, with measures of predicted accuracy.
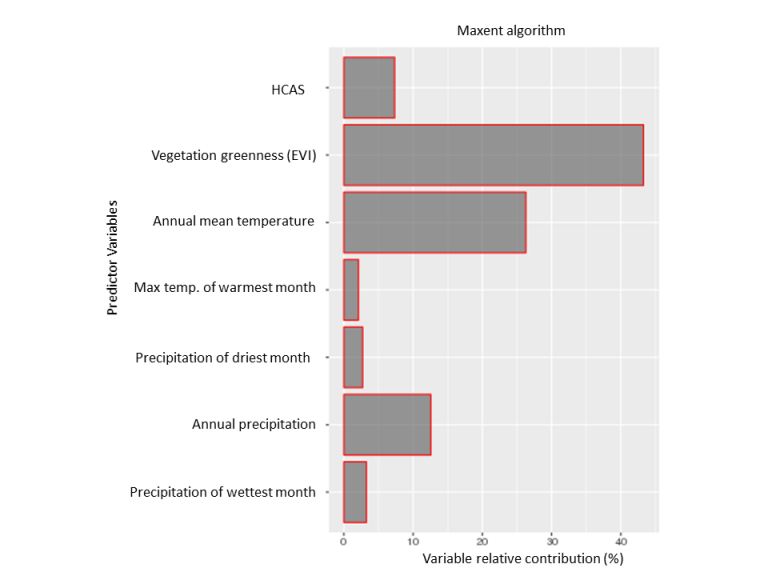
Figure 4. The relative importance of continuous predictor variables in a Greater Sooty Owl Maxent model which included an HCAS derived variable.
Our modelling has also shown that predicted suitable habitat is most common in habitats predicted to be in better condition by HCAS (Table 2). Over half of the predicted suitable habitat occurred within the best condition habitats.
Due to the relatively large home range of both of these species (4 to 10 times larger than the 1 km2 resolution used here), it is likely that had we only included breeding sites in the analyses even more of the predicted suitable habitat would have fallen within the best condition habitats.
Table 2. HCAS ordinal reclassification to estimate % of predicted suitable habitat with different conditions 0 – 0.2 = 1; 0.2 – 0.4 = 2; 0.4 – 0.6 = 3; 0.6 – 0.8 = 4; 0.8 – 1 = 5 (worst condition = 1; best condition = 5)
| Maxent ALA | BRT ALA | GLM ALA | ANN ALA | Maxent BirdLife | Maxent ALA HCAS | GLM ALA HCAS | |
| Superb Lyrebird |
1: 8% 2: 6% 3: 8% 4: 20% 5: 56% |
1: 11% 2: 7% 3: 8% 4: 20% 5: 54% |
1: 8% 2: 6% 3: 8% 4: 21% 5: 57% |
1: 13% 2: 6% 3: 8% 4: 2% 5: 54% |
Not tested |
1: 4% 2: 3% 3: 6% 4: 22% 5: 64% |
1: 4% 2: 4% 3: 7% 4: 23% 5: 63% |
| Greater Sooty Owl |
1: 8% 2: 6% 3: 8% 4: 21% 5: 58%
|
1: 13% 2: 6% 3: 7% 4: 17% 5: 57%
|
1: 8% 2: 5% 3: 8% 4: 22% 5: 56% |
1: 13% 2: 6% 3: 8% 4: 21% 5: 51% |
1: 9% 2: 6% 3: 8% 4: 20% 5: 57% |
1: 11% 2: 7% 3: 8% 4: 20% 5: 53% |
Not tested |
Overall, the estimates of the percentage of suitable habitat touched by fire were remarkably consistent between methods. In models for Greater Sooty Owl, cleaned occurrence data and environmental variables both improved the accuracy of predictions. A number of additional steps would likely further improve these models.
First, using occurrence records from breeding sites might focus modelling on the more important and potentially similar parts of these species’ home range. Additional cleaning of occurrence data and collation of data from other repositories might also improve predictions.
Second, HCAS results highlight the utility of good predictors, and variables related to forest age, or understory density are the kinds of variables that could further improve accuracy.
Third, reducing the impact of sampling bias in the occurrence data could help and might include: spatial thinning, use of a bias layer that reflects the overall sampling effort in the study area, or potentially running different models in areas where sampling intensity varied substantially.
Fourth, there are a variety of modelling parameters that can easily be adjusted within BCCVL, and many of those would likely result in better predictions if adjustments were made with an understanding of both the species being modelled and the accuracy required.
Fifth, a variety of internal validation methods could help develop confidence intervals around these predictions, and ultimately testing these predictions with independently collected data could provide confirmation of the accuracy reported here.
Finally, this kind of modelling provides just a quick initial assessment of potential impact. Work is ongoing looking to identify the true impact of these fires by considering factors such as fire intensity in each area, connectivity between unburned areas, and each species capacity to return to areas that are recovering post-fire.
What to look forward to at EcoCommons?
We ran these models in BCCVL, and each model only took a few minutes to set up, and it then ran in the cloud until it was completed, often 15 to 30 minutes later. Occasionally, for a variety of reasons, running a model in BCCVL will take much longer. At EcoCommons the team is working hard to make it faster and easier to run models, and there are plans to add scientific workflows such as Generalised Dissimilarity Modelling and Population Viability Analysis in the coming year. If you would like to follow the journey of EcoCommons as it gets developed or if you would like to be one of our early platform testers, sign up here.
References
Harwood TD, Williams KJ, Lehmann EA, Ware C, Lyon P, Bakar S, Pinner L, Schmidt B, Mokany K, Van Niel TG, Richards AE, Dickson F, McVicar TR and Ferrier S (2021) 9 arcsecond gridded HCAS 2.1 (2001-2018) estimated habitat condition for terrestrial biodiversity, 18 year trend and 2010-2015 epoch change for continental Australia. Data Collection. CSIRO, Canberra, Australia. https://data.csiro.au/deposit/51819.
Lehmann EA, Williams KJ, Harwood TD and Ferrier S (2021) A not-too-technical introduction to the HCAS v2.x mechanics: a revised method for mapping habitat condition across Australia. Publication number EP211609. CSIRO, Canberra, Australia. https://doi.org/10.25919/ek91-wj41
Mackey, B. G., Lindenmayer, D. B., Norman, P., Taylor, C., & Gould, S. (2021). Are fire refugia less predictable due to climate change? Environmental Research Letters, doi: 10.1088/1748-9326/ac2e88
Harwood TD, Donohue RJ, Williams KJ, Ferrier S, McVicar TR, Newell G and White M (2016) Habitat Condition Assessment System: A new way to assess the condition of natural habitats for terrestrial biodiversity across whole regions using remote sensing data. Methods in Ecology and Evolution 7(9), 1050-1059. DOI: 10.1111/2041-210X.12579.
Ward, M., Tulloch, A.I.T., Radford, J.Q., Williams, B.A., Reside, A.E., Macdonald, S.L., Mayfield, H.J., Maron, M., Possingham, H.P., Vine, S.J., O’Connor, J.L., Massingham, E.J., Greenville, A.C., Woinarski, J.C.Z., Garnett, S.T., Lintermans, M., Scheele, B.C., Carwardine, J., Nimmo, D.G., Lindenmayer, D.B., Kooyman, R.M., Simmonds, J.S., Sonter, L.J., and Watson, J.E.M. (2020) Impact of 2019–2020 mega-fires on Australian fauna habitat. Nature Ecology & Evolution.
Williams KJ, Harwood TD, Lehmann EA, Ware C, Lyon P, Bakar S, Pinner L, Schmidt RK, Mokany K, Niel TGV, Richards AE, Dickson F, McVicar TR and Ferrier S (2021) Habitat Condition Assessment System (HCAS version 2.1): Enhanced method for mapping habitat condition and change across Australia. CSIRO, Canberra, Australia.