 .
. 
Dr Brian Killough from the CEOS Systems Engineering Office at the NASA Langley Research Center shared some Python code that highlighted the remarkable way in which growing volumes of data can be downloaded and processed. EcoCommons was introduced to Brian through EY’s data challenge where students and early career researchers are encouraged to develop species distribution models for frogs.
The EcoCommons Team were aware of growing volumes of satellite data available on Google Earth Engine and Microsoft’s Planetary Computer. However, we had not investigated how to access or process these data sources until recently. Fortunately, Brian’s scripts gave us an introduction to the wonderful things that are possible when accessing Microsoft’s Planetary computer with the help of some excellent Python code.
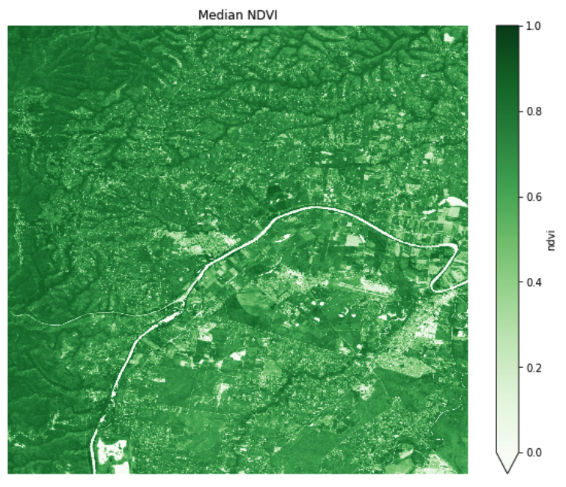
First, imagine having the freedom to generate a vegetation greenness index (NDVI) for any area over a 12 month period since 2016 at a 10 m resolution. Sentinel-2 satellite imagery is available on Microsoft’s Planetary Computer, and median values from the year are returned by using this script. When working with satellite imagery, one of the biggest challenges relates to excluding clouds from your result. With images of each location on the earth taken every ~5 days, in sunny areas, a median value automatically removes clouds from your final image. The only downside is that if you want high-resolution data for a huge area, you will probably need to tile your extent because of likely computer memory issues.
Terra climate is a massive Zarr datacube with global monthly data at 4 km resolution, with data extending back to 1958. Data comprise 14 climate variables including temperature, precipitation, soil moisture, vapour pressure, wind speed, and runoff. This script extracts a few of these variables for a small area and plots the mean monthly values from 2015 to 2020, and it would be easy to modify the script to take mean values across any time period.
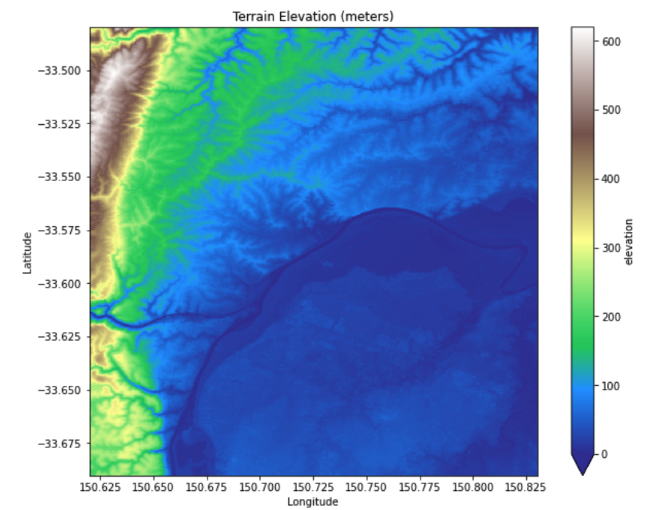
Another script demonstrates how to download 30 m resolution digital elevation model (DEM) satellite data collected during the TanDEM-X Mission, and then calculates the % slope based on the elevation data.
This final script extracts 10 m resolution Land Cover data generated by the impact observatory.
Together, these scripts provide a glimpse into the flexibility of accessing data through large data cubes. These scripts also represent a step-change in accessing and processing the rich volume of satellite imagery that has grown considerably over the decades.
